Analytics & Link Tracker
View stats (+ page) and use dashboards for reporting across campaigns.
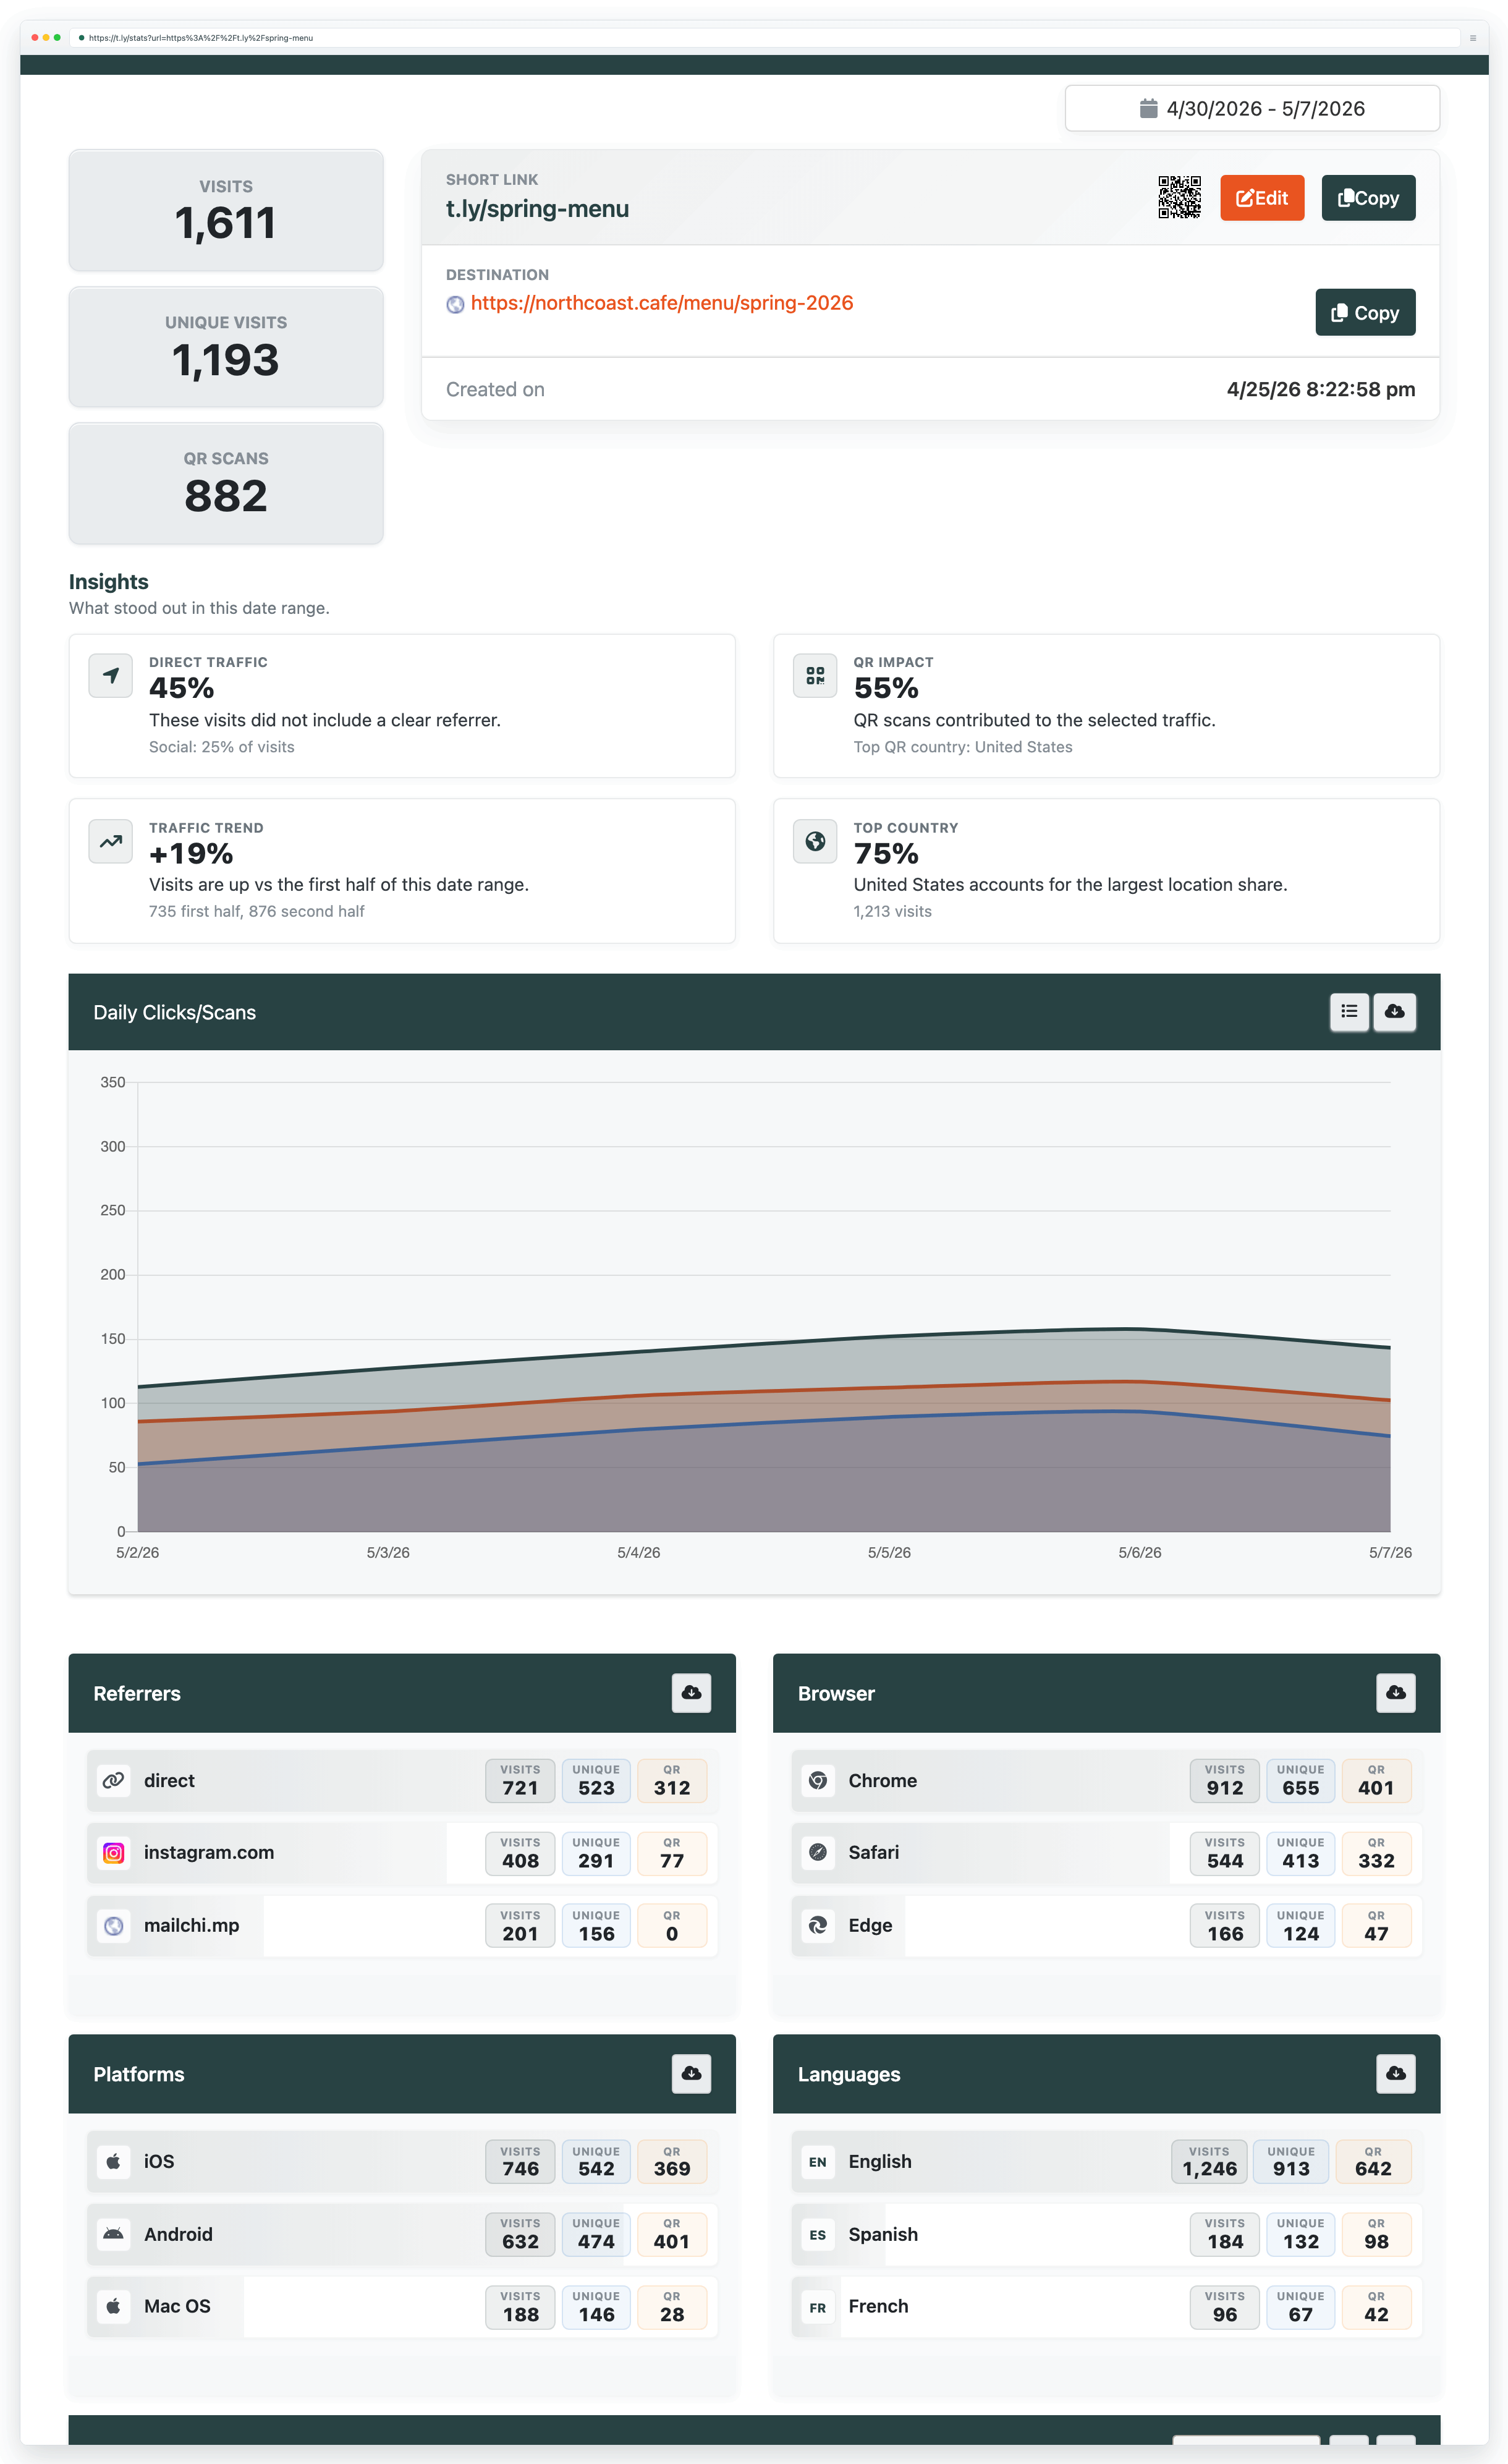
T.LY provides multiple ways to view performance, depending on whether you need a quick snapshot for a single URL or a full reporting dashboard across many links.
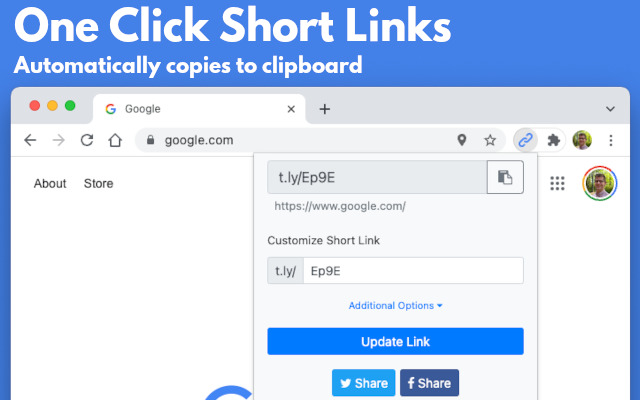
View stats for a short URL (public)
Append a + to the end of a t.ly link to open its public analytics page. Example: t.ly/P9IK+.
Use Link Tracker for dashboards and reporting
Link Tracker is designed for teams and marketers who want dashboards and reporting for link performance across multiple short links.
- Rollups: see performance across a campaign, not just one link at a time.
- Trends: spot changes over time (what improved, what dropped, and when).
- Breakdowns: understand traffic by referrer/source, device, and city-level location.
- Sharing: use reporting views (and exports, when available on your plan) to share results with teammates or clients.
- Compare placements: email vs social vs print vs QR, using one short link per placement.
Recommended setup for clean reporting
- One short link per placement: create a unique short link for each channel (newsletter, paid ad, YouTube description, QR flyer, etc.).
- Use UTMs when you care about conversions: Link Tracker shows click performance; UTMs help your analytics platform attribute conversions to the right campaign. See Campaign tracking (UTMs).
- Keep naming consistent: simple campaign and channel names are easier to filter and report on later.
- Consider branded domains: custom domains increase trust and make links easier to recognize across channels.
Why pixel tracking sometimes does not work
Ad blockers, privacy-focused browsers, and browser extensions can prevent tracking pixels from loading. Mobile privacy changes can also reduce attribution. In practice, pixel data is often directional rather than exact, so it is best to combine it with click/scan analytics when measuring performance.
Related guides
Need more help?
If you still have questions, contact [email protected] or use the contact form. For abuse or suspicious links, use Report Abuse. For feature requests, email [email protected].